
Project Analytics
Track page views, traffic sources, and popular content in Jamdesk's privacy-focused analytics, which work without cookies and keep visitor data anonymized.
Track page views, traffic sources, and popular content with built-in analytics. No cookies required.
Analytics are privacy-focused: no cookies, anonymized data. If metrics look empty, see Analytics Issues.
Viewing Analytics
Go to dashboard.jamdesk.com and select your project.
In the sidebar, click Analytics.
Pick a period with the date picker:
- Last 7 days (default)
- Last 30 days
- Last 90 days
- Custom range
What's Tracked
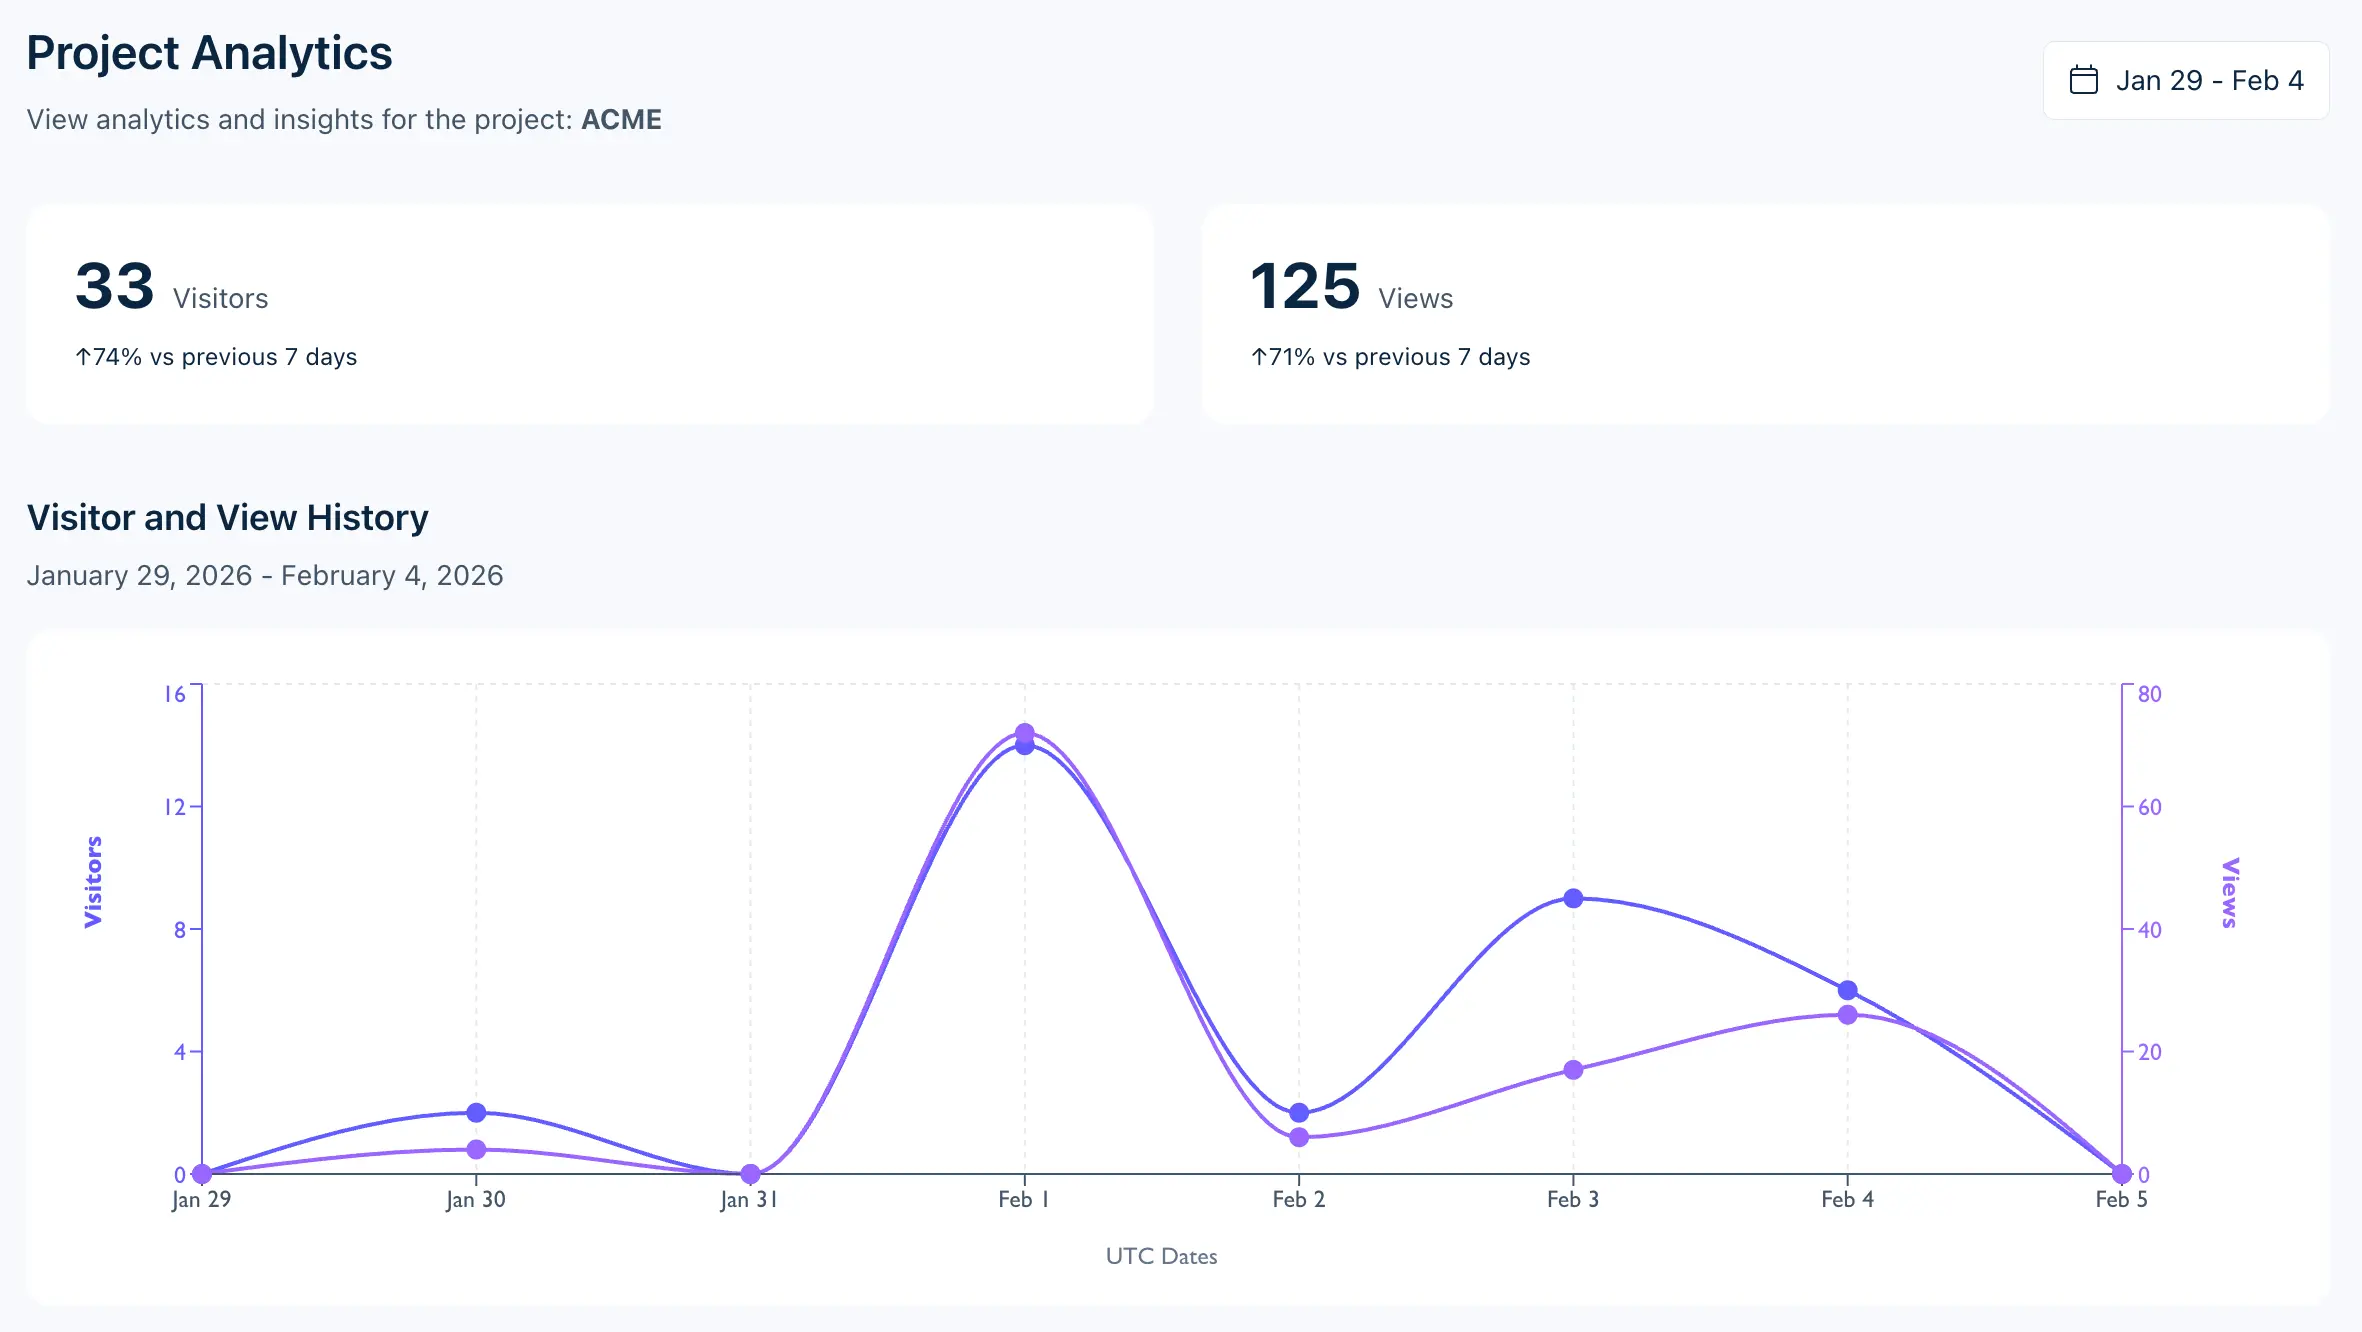
Overview Metrics
| Metric | Description |
|---|---|
| Visitors | Unique sessions in the selected period |
| Views | Total pages viewed |
Each metric shows the percentage change from the previous period.
Example snapshot:
{
  "period": "Last 30 days",
  "visitors": 4120,
  "views": 12890,
  "top_referrers": ["google.com", "github.com", "direct"],
  "top_pages": ["/introduction", "/quickstart", "/content/mdx-basics"]
}
Popular Pages
See which pages get the most traffic. Use this to:
- Find high-traffic content to keep updated
- Find pages with low engagement
- See how readers move through your docs
Traffic Sources
See where your visitors come from:
| Source Type | Examples |
|---|---|
| Search engines | Google, Bing, DuckDuckGo |
| Social media | Twitter, LinkedIn, Reddit |
| Direct | Typed URL or bookmarks |
| Referrals | Links from other websites |
Geographic Data
View visitor locations on an interactive world map:
- Country breakdown: visitors by country
- Visual heatmap: darker colors indicate more traffic
Use the country breakdown to decide which languages to prioritize for localization.
Technology Breakdown
See the devices and browsers your visitors use:
- Chrome, Safari, Firefox, Edge
- Spot browser-specific issues
Entry & Exit Pages
| Metric | What It Shows |
|---|---|
| Entry Pages | First page visitors land on |
| Exit Pages | Last page before leaving |
Use this to:
- Improve landing pages (entry points)
- Find where readers drop off (exits)
Privacy Features
SPA Navigation Tracking
Jamdesk counts each client-side navigation as a separate page view, even without a full page reload. This covers:
- Internal links within your documentation
- Browser back/forward navigation
- Programmatic navigation
Data Retention
Raw events are kept for 90 days. Each day's events are rolled up into daily totals. The totals are kept after the raw events are deleted.
Comparing Periods
The dashboard compares your selected period to the previous period of the same length:
- Last 7 days compares to the 7 days before that
- Last 30 days compares to the 30 days before that
Percentage change badges:
- Green badge for increases
- Red badge for decreases
Use the comparison to spot trends after you change your documentation.
Best Practices
Keep your most-viewed pages accurate and easy to navigate.
Give pages that get search traffic enough context and clear next steps.
If much of your traffic is mobile, test your docs on mobile devices.
Check referrer data to see which channels send the most traffic.